
Things have not gone great so far this season for Tanner Roark. He’s gave up 6 ER in his last start, 7 the game before that, and already has six starts of 4 ER or more. Last year he had 8 all year. Last season he had a great season, finishing 10th in Cy Young voting.
Starting with the Basics
 Comparing him to last year should give some insight into what is happening differently. His ERA of 2.83 last season might have been unsustainable considering his 3.79 FIP. But his current 4.88 ERA is way past that, and his FIP is up to a 4.33. First thing I did was to check his strikeout and walk rates. But they are so close to identical from last year it’s almost funny. His K/9 of 7.2 today, compared to 7.4 last year, is almost as close as his BB/9 of 3.0, where had a 3.1 in 2016.
One thing that did change, though, is his hit rate. It’s up, way up. Last year he was at a .228 AVG against, this year’s currently sits at .274. With similar K rates and walk rates, it’s not surprising that this also has an effect on his BABIP (or vice versa?). Last year was .274, and a .281 career number is a pretty good indicator of what you’d think he should do. This year it’s .315.
With BABIP comes the inevitable discussion of luck, and yes, that probably does play something of a factor. Also BABIP leads to a defense discussion. And the Nats defense isn’t exactly the best in the league. But, according to Fangraphs, it ranks just below average (-4.4), which isn’t good, but it’s not incredibly bad. Last year they were better, a tiny bit below average (-0.9), and while it may have some effect, it’s probably not enough to explain it all.
Not Just Hits, Hard Hits
Ok, so we probably have some amount of worse luck here, as well as some amount of worse defense. But most of the problem seems to lie with Roark, and we get a clue from another rate – his slugging against. Or more specifically, his ISO against. That number has jumped from .099 to .136. It’s not terrible, and even in his very good 2014 he had an ISO against of .112, so .136 alone should translate to a near-5.00 ERA. But in 2014 he had a walk rate below 2 per 9, and AVG against of only .239 so he could afford the higher power against. Not this season. Coupled with more hits, that increased power is really hurting him.
Digging in to the results more, his GB/FB rate is a bit lower this year, but not by much. A GB rate of 47.0% this year, compared to one of 48.7% aint much, so it’s probably not a big worry. Except virtually all of those missing grounders are turning into liners, which went to 21.4% this year from 20.1% last year. It seems that people are hitting the ball harder off of him.
And, wait for it… I’ve just confirmed that assumption, as fangraphs lists the changes to his soft-medium-hard hit rates as, in order, -9.2, +4.2, +5.0. In other words, yeah, luck may have something to do with it, and defense maybe as well, but Roark is getting, er, lit up because people are hitting the ball better off of him. They are making less weak contact, and about half of that difference has shifted all the way to hard contact. Not good.
Still OK Against RHH, But LHH…
Its seems that a good deal of this comes from a pretty bad platoon split. Righties are doing slightly better against him with a .660 OPS instead of last year’s .648. This is small enough that it really could just be bad luck and slightly worse defense. RHH AVG is 21 points higher, but their slugging is actually 6 points lower. So, of course, their ISO is even lower and… oh no I just realized this means lefties are destroying him. I’m afraid to look. Let’s do it together.
Last year, he had reverse splits. Lefties hit a measly .214/.315/.302 against Roark. That was good! This year, they’re hitting .287/.358/.479. That’s really bad. That’s an ISO difference of 104. That’s huge.
Digging in a bit to what he’s throwing, while there are a few differences, including an increased use of a cutter, the usage rates are pretty close. There are a few charts that could show some differences (almost every pitch shows a slight uptick in average, so is LD rate), but check out the ISO against by pitch vs LHH:
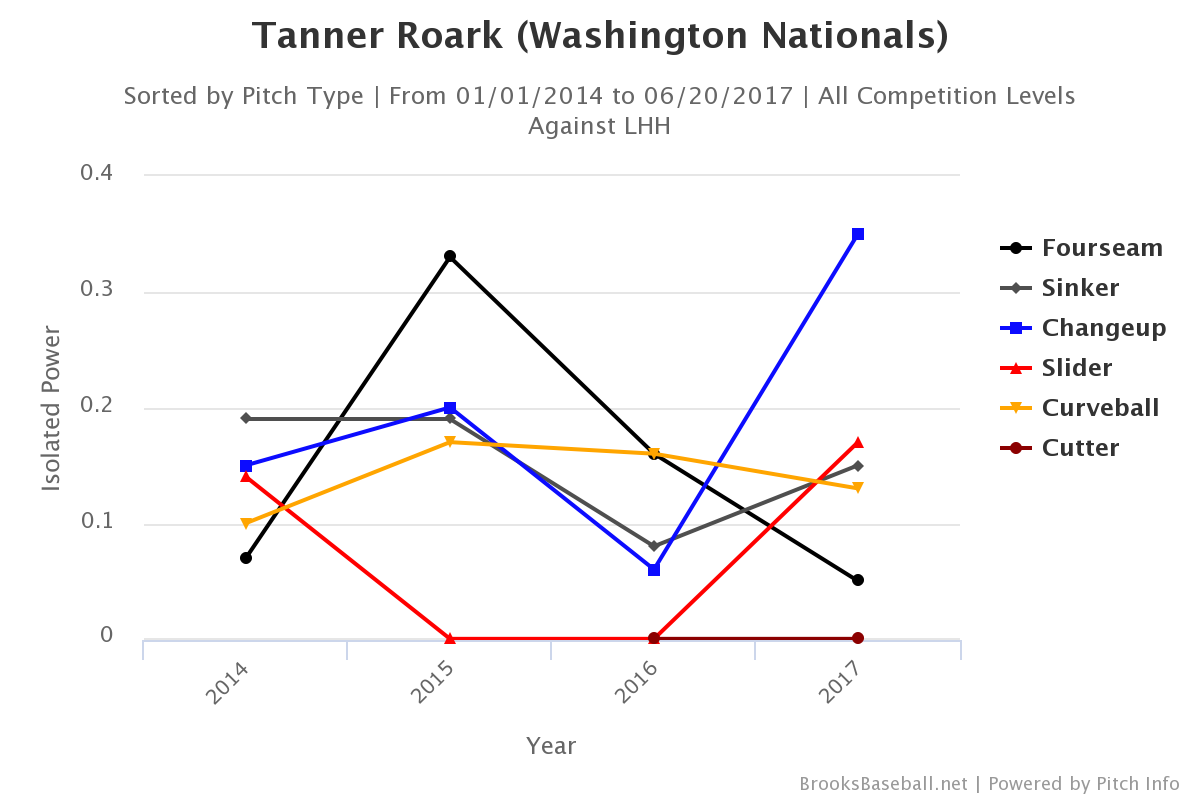
Whoa, that changeup. And that’s not a small sample blip – about 17% of his pitches against lefties are changeups. The slider, too, is getting mashed this year, although he barely uses it against lefties so it’s much less relevant. Added to this is that the swing rate on the changeup is way up from LHHs, from 48.5% to 54.1%. They’re swinging at the changeup more in general, but the bulk of that increase (6.7% out of a total 8.4% delta) comes from inside the zone.
This certainly isn’t the entire difference, but it’s demonstrative. As a whole, Roark’s opponents are swinging at pitches outside of the zone less (25.9% this year vs 28.9% last year) and inside the zone more (68.1% this year vs 62.3% last year) and it is allowing hitters to be more selective against him. And this isn’t just lefties, it’s righties, too.
Righties have been slightly more effective than him, but lefties have hit for significantly more power. The changeup against lefties especially has been bad. But fixing the changeup may not be enough, as hitters from both sides seem to be more selective, swinging more at strikes and less at balls. If Roark can improve the effectiveness of his changeup and start doing better against lefties, his numbers will look much better. Getting lefties out again should be his priority, but to get back to being the Roark of 2016, he’d also have to figure out how to get the previous swing rates back.