
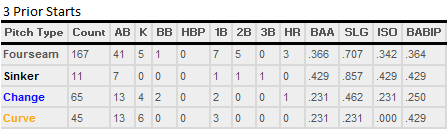
After checking out the issues with Strasburg‘s pitches over his last few starts, the conclusion was that while the offspeed stuff still looked good, the fastball wasn’t working so well. As we looked over his three starts prior to July 1, in which he was hit hard, the results on the fastball were surprisingly bad
After yesterday’s start, where he went 7 2/3, he struck out 8, only walked 1 and gave up 1 ER (on a HR that came via a curveball), we know that fourseam fastball is gonna look pretty sweet. So here are the numbers
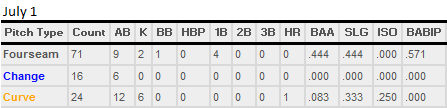
There you have it, nice and neat, and now that we can move on to wait whaaaaaaaaaa?
Yeah, he had a great start despite, judging by those results, his fourseamer was hit quite a bit. But here’s the thing – it really wasn’t. It’s time for me to go a little more in depth and try to learn a bit more about what this numbers really mean.
You see, these results show you how well the ball was hit, WHEN it was hit. There are also all of those fastballs thrown that don’t result in outs. So while, yes, I was right that when it was hit, his fastball was getting hit hard, that doesn’t mean it was always hit. Yesterday was a good example. There were 4 singles and a walk off his fourseam fastball. But he threw it 71 times. So there were plenty of times when they didn’t hit it – they swung and missed, they watched a strike go by, they fouled it of, etc.
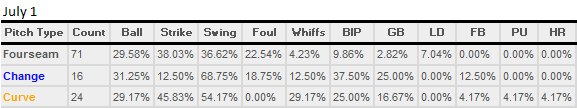
I realize now that what I wrote about Sunday still tells us some very interesting information. But it doesn’t quite tell us enough. How do we dissect it a bit more? Well, thankfully, Brooks Baseball and PitchFX has more data for us. Starting with what they call the Pitch Outcomes:
Compare this with those three bad starts before
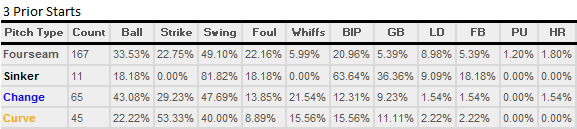
Individually those charts might not tell us enough (do you know what a good whiff rate is? I don’t). However, comparing the two gives us some interesting results. Let’s just concentrate on the fourseamer to keep this simple(r).
Firstthing I notice is the ball rate was lower last night. That’s probably a good thing. The swing rate was lower, too, and that’s probably not as good. But let’s look at the 3 results fom those swings – a whiff, a foul, or a ball in play.
These numbers add up to the Swing number. So in the three prior starts they were fouling off at a lower rate because even though the numbers are almost the same, it is a smaller portion of the swings. This is a little confusing, but it will become more apparent in the next set of charts. The more important thing this shows is that how much lower of a rate the opponents were putting balls in play (BIP). Again, the next few columns are additive (BIP=GB+LD+FB+PU+HR) so the percentages look decieving. It looks like he wasn’t inducing as many grounders. But he was.
Rather than dwell on this, let’s just look at what they call Sabermetric Outcomes. Don’t be scared:
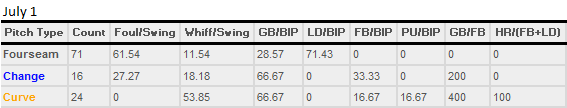
and again for the 3 starts before
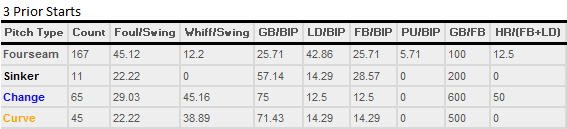
The reason I showed the other charts first is because I think the ball rate is important. But other than that, these are much more clear. The Foul/Swing and Whiff/Swing columns are rates, plain and simple. One thing I wish Brooks Baseball showed was the implied final column in that section – BIP/Swing. The assumption is that Foul+Whiff+BIP per swing should add up to 100, but the BIP isn’t shown. I’d like to see it to confirm I’m not taking crazy pills.
What do we see from those? Well, the whiff rate was essentially the same last night, but the foul rate was higher. They were putting fewer balls in play per fastball. Ok, on to the next set of columns, the GB, LD, FB, PU rates. These are much more intuitive to me, and show much more clearly, his rates. You can see his GB rate actually went up last night (albeit very slightly), not down. The LD rate was pretty ginormous though, and he didn’t get any popups or flyballs.
You usually want to keep the LD rate low, although FBs are the ones that tend to turn into HRs, most of them are outs. That being said, it probably also is a good indicator that they weren’t able to get too much lift on the pitch. While I have a feeling LDs are great, in this case I think it demonstrates they were really mostly hitting the ball on the ground. One more thing of note – he threw his fourseamer 63.9% of the time last night, 57.9% of the time in the previous starts. So not too much difference there.
That’s A Lot to Take In
Bringing all of these numbers together, and trying to take some meaning out of them, isn’t the easiest thing. But it leads to some conclusions that I think make alot of sense, so here goes. On July 1, with his fourseam fastball, in comparison to the three previous starts he got shelled:
- Strasburg was throwing fewer balls/more strikes
- He threw more fourseamers, barely, so he didn’t fix it by “mixing his pitches” more (although it’s possible he mixed them better)
- Opponents were fouling off more pitches, and swinging and missing at the same rate, therefore they were putting fewer balls in play
- Opponents were hitting more groundballs, slightly
- Opponents were not hitting anything in the air, which might be a signal that even though the GB rate wasn’t much higher, it was better than it looked
- Strasburg probably located his pitches better, which is part of the added success and lower ball rate
- When people do get hits off Strasburg, and they sometimes do, they do it off the fastball. I think this is probably because they realize they are usually waiting on the fastball, and when they get it, they can occasionally do something with it
- While the ISO power from the results chart is worth noting, hitting .444 on balls in play off a pitch looks very different than getting 4 hits on 76 fastballs thrown