
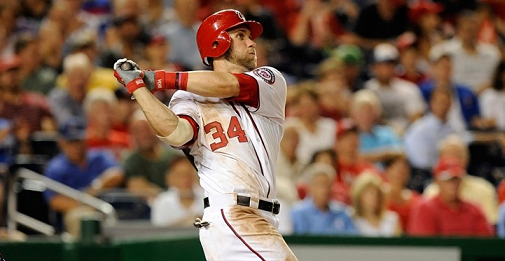
The Nats offense continues to struggle to score runs, although as I’ve pointed out, they have 5 or 6 players that can easily be counted among the best hitters in the NL at their position. This seems odd to me, and I don’t think it’s all just bad luck or poor hitting with RISP.
I wanted to find out if there was a way to measure what the advanced statistics show they should be scoring, and see how far off it is from reality. The metric I came across (well, that was suggested to me by Bosque on twitter) was wOBA. From wOBA you can deduce wRAA and there you have it.
Ok, what are these stats? Here are a few links, and here’s my quick explanation
- wOBA (weighted on base average) is like a souped up version of OPS, in that it’s supposed to show you all the offensive contribution of a player in one handy statistic. It’s normalized to be more like OBP in terms of what’s good (.340-ish and above) and what’s bad (.320-ish and below)
- wRAA (weighted runs above average) is how many runs a player contributes to the team above the average player. That word “average” is very important. We’re not talking about sometimes confusing “replacement level” guys. If your wRAA is 1, you contributed 1 more run than the number of runs that you get when averaging all players’ runs scored in the league
wOBA is a rate stat, much like OBP or SLG or AVG, so it doesn’t show us how many runs are scored. But with some calculations, it can be turned into wRAA per PA. Multiply by the number of plate appearances a guy has, and you have wRAA.
You can then add up everyone on a team’s wRAAs and see what the team should do offensively – that is, how their run production should compare with the league’s average. And that’s just what I did for the Nats.
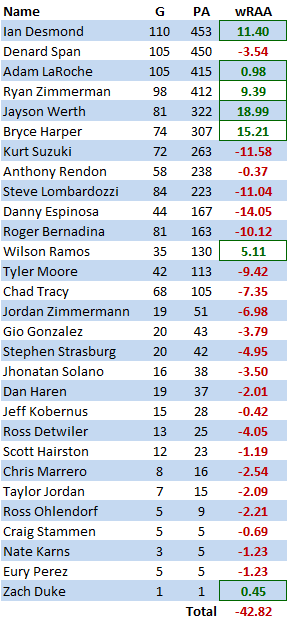
First things first – this shows that, no, they aren’t incredibly unlucky to the point that they should be scoring more runs than everyone. This shows that they’re hitting like a team that can’t score. Because remember, wOBA, and therefore wRAA is based upon the results of their PAs. So the PAs indicate that they are a below average offense. But that’s not the whole story.
[button url=’#’ size=’small’ style=’blue’] Born Under a Bad Sign [/button]
There is definitely some bad luck involved here. The Nats have scored 415 runs this season through 112 games. Meanwhile, the average runs scored per team this year is 4.19 for the entire league. Using that number, the a team needed to score 469 runs over 112 in order to hit the league average on the dot.
In other words, the Nats have actually scored 54 runs less than average this year, a good amount worse than their wRAA would indicate. It’s actually almost 11 runs fewer than the stats suggest (a number that is 29% larger than the 42.82 runs below average they should have).
Some of this difference is a result of the nature of these statistics. It won’t come up with the exact correct answer, it’s an approximation. But “luck” is a real thing in the world of baseball statistics – heck, BABIP is basically a measurement of it – and the Nats luck is bad in this case.
Further bad luck in the more overall sense comes from the fact that looking at this makes it pretty clear how much this bench has played a role in this. Most of the players in the negative on that list, other than the pitchers, are bench guys. The starters all are positive, except for Denard Span and Anthony Rendon, and neither of them are horrendous.
Just as a little experiment, I decided to see how this team would have done if they had just been relatively healthy all year. I basically upped the PAs of two hurt players, Jayson Werth and Bryce Harper, to 400 PAs. It’s not the 453 that Ian Desmond has, but I’m trying to keep this somewhat realistic. Wilson Ramos didn’t get as many PAs because he’s a catcher, but I still gave him a bigger number. I also brought Rendon in a bit earlier, giving him another 100 PAs. To keep the total number of PAs for the team consistent, I had to debit from the bench players, and I tried to keep those reductions appropriate.
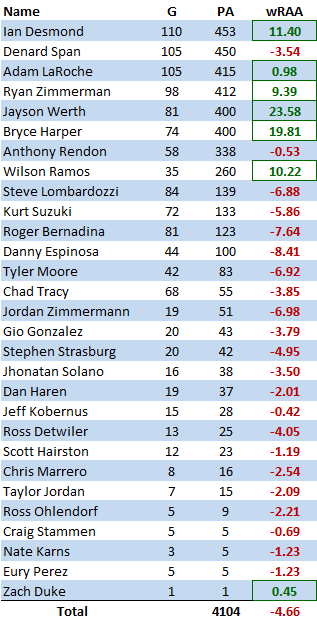
Suddenly the offense starts to look quite a bit better. Is it prolific? No, because they still have an incredible drag from the bench, even though the bench is used significantly less. It’s worth noting that the top 8 players in this scenario, plus the pitchers, have a wRAA of +43.77, a much better than average offense.
Clearly, no team is going to avoid using bench players, but this team really has been hurt by how bad the bench has been. Well, that and Danny Espinosa. To put it in perspective, Espinosa’s drag on the offense (from the first chart) has completely canceled out Ian Desmond’s add to it. He and Steve Lombardozzi combined to take away more runs from the average than Harper and Ryan Zimmerman added together.
Rendon, meanwhile, is just below average, which isn’t a nice as a positive number, but Lombardozzi and Espinosa have combined to drag this team 25 runs below average. That’s just one example, the bench anchor is prevalent through every position.
Without all that time given to bench players, substituting a season with less injuries, they’ve suddenly got a league average offense. That’s with LaRoche producing very little compared to what first basemen are supposed to do. This is still with giving all those bench players plenty of PAs, more than a completely healthy team would have. The starters, as a group, are good, and this is reflected here.
They have certainly hit enough to score, and yet they haven’t. The wRAA stat indicates some of this might be pure bad luck, something that has followed this team around all season. Besides the bad luck of timely hitting, though, the bench has absolutely killed them, and the bad luck of injuries hasn’t done them any favors.